 Bitcoin: Bitcoin Cycle Master

Actualizar al plan Avanzado para ver esta métrica
Comparar todas las características del plan aquí
Actualizar a AvanzadoAcercarse con la pantalla táctil: Toca y mantén con UN dedo y luego arrastra.
Acercarse al escritorio: Haz clic con el botón izquierdo y arrastra.
Reiniciar: Doble clic.
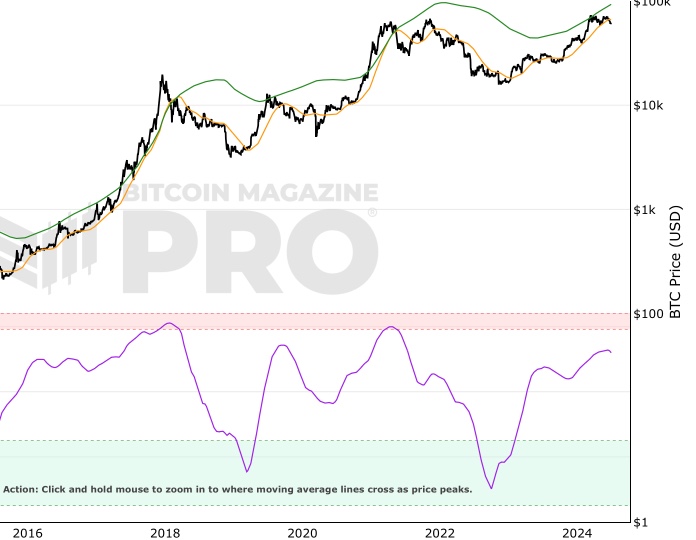
Indicator Overview
Bitcoin Cycle Master is a combination of on-chain metrics including Coin Value Days Destroyed and Terminal Price. They are able to identify where Bitcoin price is valued relatively within its cycles. Historically those cycles have been approximately every 4 years and correlate with Bitcoin Halving events. There is no guarantee that will continue to be the case in the future, and the metrics that make up Bitcoin Cycle Master track actual economic behavior on the Bitcoin blockchain.
Bitcoin Cycle Master can identify periods of increased risk when transaction behavior on-chain is indicative of major cycle highs. It also identifies areas of value opportunity where on-chain transaction behavior signals major cycle lows.
También puedes estar interesado en

Power Law
Bitcoin linear regression model
Pi Cycle Top & Bottom Indicator
Pi Cycle Top and Bottom Indicator.

Pi Cycle Top Prediction
Predicting when the Pi Cycle Top Indicator will cross.
Tome decisiones más inteligentes sobre Bitcoin. Al instante.
Acceda a los Gráficos Macro Globales y de Bitcoin que realmente impulsan el precio de Bitcoin.
+40 alertas de gráficos. No vuelvas a perderte niveles críticos en los gráficos.
Boletín de análisis. Controle sus emociones en los extremos del mercado.
Indicadores privados de Tradingview. ¡Vea los niveles del gráfico de Bitcoin en tiempo real!
Cancela en cualquier momento.
La información contenida en este sitio no debe considerarse asesoramiento financiero. Por favor revise la Descargo de responsabilidad para más información.